
Netflix’s July 13, 2026 post, Building Service Topology at Scale, and InfoQ’s August 11, 2026 summary, How Netflix Scaled its Real-Time Service Map, describe one pipeline. eBPF flows, IPC metrics, and traces stay in separate layers. This diagram is the network path: aggregate, resolve intermediaries, enrich, store. Where the pages disagree, keep both lines.
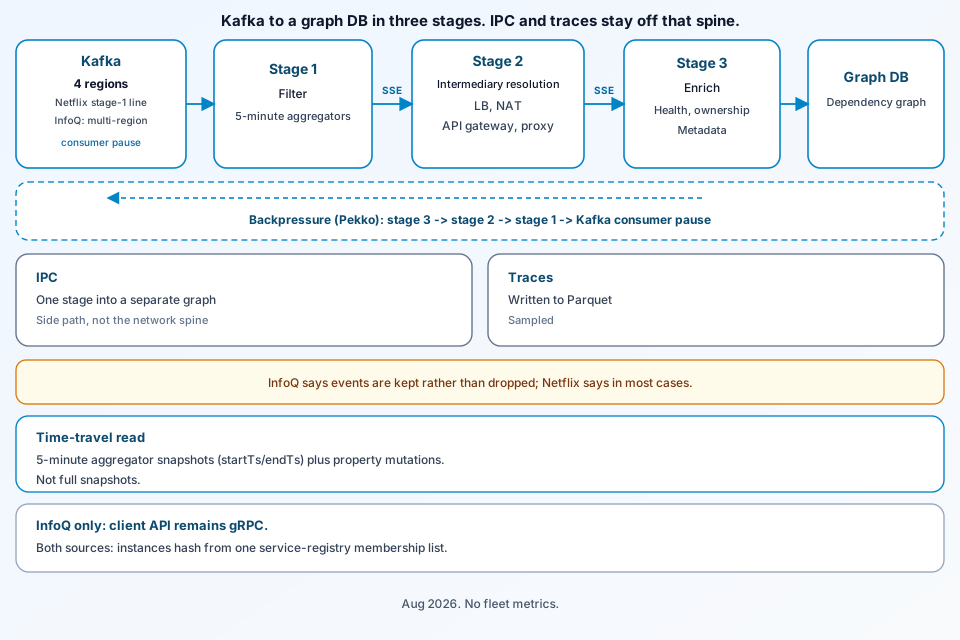
What this Netflix Service Topology architecture diagram shows
Netflix stores eBPF flow logs in one graph partition, IPC metrics in a different graph database, and sampled traces in Parquet. A query can use one layer or merge them. InfoQ repeats that split and the uses Netflix names: incidents, blast radius, dependencies, and change management. Only network flows need three stages, because a flow log is a hop, not an application edge.
The problem this architecture is solving
A load balancer, NAT gateway, API gateway, or proxy splits one call into App A to the intermediary and the intermediary to App B. Engineers want App A to App B. Netflix says Kafka partitioning scatters those hops, so stage 2 reshuffles by intermediary id. InfoQ says instances that also did enrichment I/O saw up to 100 times typical traffic. Netflix uses “100x” for that hot-node problem and again to claim that, after the third stage, no single instance stays a bottleneck at that skew. The second use is a design claim, not a new measurement.
Main components and trust boundaries
Stage 1 is the FlowLog Ingestion Service. Netflix’s stage line says multi-region Kafka from four regions, a filter for invalid logs, five-minute windows, an initial aggregator per window, consistent hashing, then SSE to stage 2. InfoQ says multi-region Kafka and the same five-minute batch, and does not repeat the count of four. That is a missing detail, not a conflicting count.
Stage 2 groups flows by intermediary, joins source-to-intermediary with intermediary-to-destination, keeps which intermediaries were crossed, and combines metrics from both hops. It hashes again and streams to stage 3 over SSE. Stage 3, the GraphEntity Ingestion Service, does the final rollup, reads health, ownership, and other metadata from key-value stores, turns aggregators into nodes and edges, and writes the graph with throttled batches. Netflix says a later change stopped converting aggregators into full entities until this last write, and standardized SSE payloads on JSON after custom serialization misbehaved. InfoQ does not describe that JSON switch.
Both pages say server-sent events replaced gRPC between stages. Netflix cites serialization, connection pools, and streaming memory. InfoQ adds a line the Netflix text fetched here does not: SSE is internal, and the client API is still gRPC. IPC stays one stage on both pages because the metrics are already application calls, partitioned by application. Both the Netflix TechBlog of 13 Jul 2026 and InfoQ say each instance reads one healthy-member list from the service registry and hashes from that list. Netflix’s line is consistent hashing with dynamic instance discovery from the service registry. The InfoQ-only line is that the client API remains gRPC.
Backpressure is Apache Pekko Streams in InfoQ’s wording. Netflix names Pekko when it describes tuning parallelism, buffers, and async boundaries after an early configuration over-parallelized some stages. The direction is the same on both pages: if the graph write stalls, stage 3 signals stage 2, stage 2 signals stage 1, and the Kafka consumer pauses. Records wait in Kafka.
Request or data path, step by step
Flow logs arrive from Kafka. Invalid records drop at stage 1. Surviving hops become aggregators for a five-minute window and move by SSE. Stage 2’s join emits a direct edge plus the intermediary trail. Stage 3 enriches, then persists. A reader can ask for one layer or a merged view. Netflix says merged reads run in parallel across the stores and calls the result sub-second. That latency, and “millions of flow records per second,” are Netflix’s production claims. InfoQ does not repeat either figure. They are not a contract.
Both pages reject full snapshots and raw-log replay. They keep time-windowed aggregator snapshots and property-level mutation history. Netflix adds startTs and endTs on each five-minute aggregator, a key of entity id plus timestamp, and a mutation-history API applied in order. It also says read time can regroup by tier, business domain, or cluster. InfoQ stops at reconstructing a point in time.
The diagram: labeled boxes and failure or isolation edges
Top lane: Kafka (Netflix’s stage-1 line says 4 regions; InfoQ says multi-region) into stage 1, SSE into stage 2’s intermediary join, SSE into stage 3 enrichment, then the network graph. Side lanes: IPC metrics into a single-stage pipeline and a separate graph; traces into Parquet, marked sampled. A dashed arrow runs backward for Pekko backpressure until the Kafka consumer pauses. The time-travel box is solid: 5-minute aggregator snapshots plus property mutations, not a full snapshot. The only dashed box is the backpressure banner.
- Hot key: InfoQ and Netflix both describe an older two-stage design, where resolution and enrichment shared the hot instance. That design is not a box on this diagram.
- Pause, don’t drop — with a caveat: InfoQ says the design leaves records in Kafka rather than dropping them. Netflix says no data is lost “in most cases.” Those sentences disagree. Both stay.
- Freshness: Netflix says updates are typically within tens of minutes versus hourly or daily batches, and also says a slowdown lands “a few seconds or minutes later.” The same post does not reconcile those phrases. InfoQ only says freshness is delayed under load.
- Client versus stage: stage transport is SSE. InfoQ alone says the client API remains gRPC.
What the source does not claim (preview, case study, or limits)
Neither page is a preview. Netflix’s July 13, 2026 piece is a retrospective of lag, memory, garbage collection, hot nodes, then heap, serialization, Pekko tuning, uneven writes, and enrichment. Those are lessons, not an SLO. “Sub-second” queries and millions of records per second are Netflix’s claims; InfoQ does not repeat them. Traces are deferred to another post. The diagram does not name a graph product or a Pekko buffer size, and it does not add regions beyond Netflix’s stage-1 line of 4, which InfoQ still calls multi-region.
FAQ
Why does the network-flow path have three stages when IPC has one?
Both pages say flow logs are hops through load balancers, NAT, API gateways, or proxies, so stage 2 must reshuffle by intermediary before a direct application edge exists. IPC metrics are already application calls and are partitioned by application, so they aggregate in one stage. Netflix also stores traces separately, in sampled Parquet.
Do InfoQ and Netflix agree that the pipeline never drops records?
No. InfoQ says backpressure pauses the Kafka consumer so records stay in Kafka rather than being dropped. The Netflix post says no data is lost in most cases. The dashed Pekko arrow is a backpressure return to a Kafka consumer pause, and the “in most cases” qualifier stays.
How does Service Topology answer “what did the graph look like during the incident?”
Both pages say it keeps time-windowed aggregator snapshots and property-level mutation history, not a full snapshot of every moment and not a raw log replay. Netflix adds five-minute startTs and endTs checkpoints and a mutation-history API. It also claims sub-second merged queries; InfoQ does not repeat that latency.
Conclusion
The picture is Kafka, three SSE-connected stages, a separate IPC stage, sampled traces, and a time-window graph with property mutations. Keep InfoQ’s “no drop” line next to Netflix’s “in most cases,” and keep “tens of minutes” next to “seconds or minutes” instead of picking one. Cite the Netflix engineering post and the InfoQ summary. More diagrams are on the ByteDiagram blog.
Diagram Netflix’s three-stage service map
Place the Kafka windows, the intermediary join, the enrich-and-store stage, and the backpressure arrow — and leave the two freshness phrases side by side.
Open Diagram Editor