
The OpenTelemetry gateway deployment page defines a gateway as applications, or other Collectors, sending signals to one OTLP endpoint backed by one or more Collector instances run as their own service — often one endpoint per cluster, data center, or region. This evergreen diagram is that tier, plus the agent-to-gateway variant where a DaemonSet agent sits on each host. A July 14, 2026 AWS Cloud Operations post shows one way to run the same shape on Amazon EKS and export to CloudWatch. Treat that post as a how-to with its own prerequisites, not as the Collector specification.
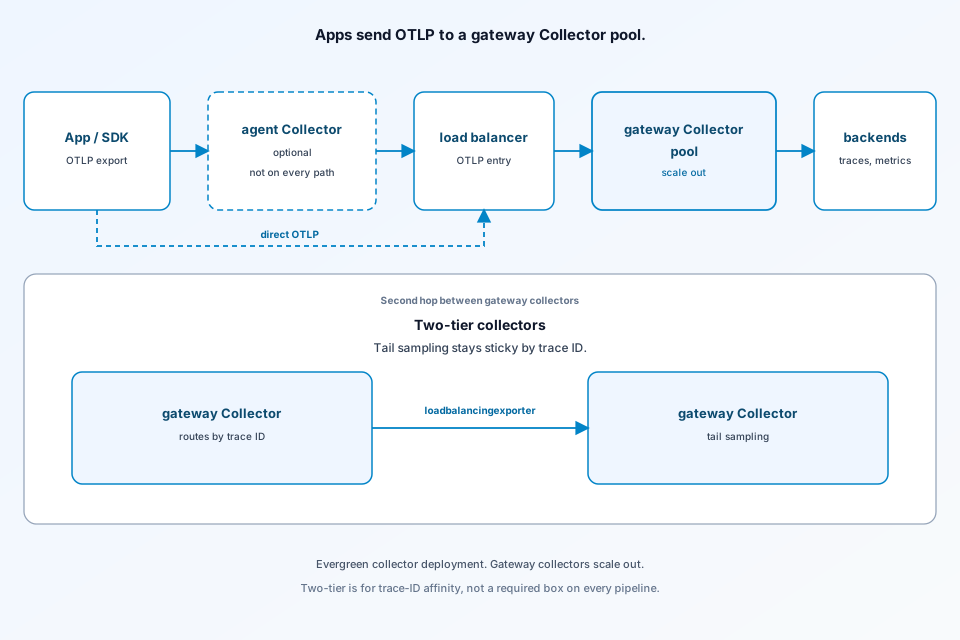
What this OpenTelemetry gateway collector architecture diagram shows
Single-tier puts an external load balancer in front of Collectors. The doc’s NGINX example listens on 4317 (gRPC) and 4318 (HTTP) and fans out to three collectors — an example, not a required shape. Two-tier is for work that must see a chosen subset. A first-tier Collector runs the load-balancing exporter so, for tail sampling, every span of a trace hits one second-tier Collector. In that picture the “load balancer” is a Collector.
The problem this architecture is solving
Agents stay small while gateways do filtering, sampling, and batching with a wider view, including complete traces, and they hold backend credentials. The cost, in the gateway doc, is another failure domain, extra latency from cascaded Collectors, and more resource use. Skip the pattern when apps can export OTLP directly, you do not need host telemetry or tail sampling, or the deployment is small.
Main components and trust boundaries
Applications speak OTLP to a local agent on the host network. The agent page’s diagram then shows agents sending OTLP/gRPC to gateways on the cluster network, and gateways exporting to backends with TLS. Credentials for those backends belong on the gateway, which is the centralization the docs are arguing for. The agent examples bind receivers to 0.0.0.0 for convenience and warn that localhost is preferable when every client is local, because the Collector defaults to localhost and an open bind is a denial-of-service concern. The AWS post is stricter about its walkthrough: keep OTLP in-cluster, do not expose it publicly, restrict ports with a network policy, and enable TLS across trust boundaries. Its sample manifest sets insecure OTLP only for the in-cluster hop.
Both tiers should run memory_limiter first (backpressure instead of an out-of-memory crash) and batch before export. Sample configs use 512 MiB on an agent and 2048 MiB on a gateway — examples, not limits. Tail sampling belongs on the gateway. The sample policy keeps ERROR traces and 10 percent of the rest; that rate is the example, not a recommendation.
Request or data path, step by step
Without tail sampling, any load balancer or a Kubernetes Service with round-robin can spread agents across gateway pods. The gateway doc says every OTLP metric stream still needs a single writer and a globally unique identity. Two Collectors writing the same series can overwrite each other. That page mentions gaps or jumps in a series, and a Prometheus ingest error for out-of-order samples, as clues. It points at the Kubernetes attributes processor and the resource detector as ways to make resource identity explicit. The agent-to-gateway page, not the July 14, 2026 AWS post, raises that single-writer concern when you scale gateway instances that export metrics.
Tail sampling needs affinity. The load-balancing exporter’s routing_key is traceID (one trace, one Collector) or service (the gateway doc cites span-metrics). Resolvers are static host lists or DNS. It emits otelcol_loadbalancer_num_backends and otelcol_loadbalancer_backend_latency. The agent doc warns that trace-ID routing re-splits when backends change, and it prefers one well-sized tail-sampling gateway unless sticky routing is solid. Cumulative-to-delta has the same one-series rule. Agents scale up per host; gateways can scale out. HPA on CPU or memory is mentioned as an option, not a requirement.
The diagram: labeled boxes and failure or isolation edges
The labeled path is an app or SDK, an optional agent Collector that direct OTLP skips, a load balancer, a gateway Collector pool, and backends. The agent-to-gateway page shows gateway export over TLS. Sticky tail sampling is a second hop between gateway Collectors via the load-balancing exporter, and two-tier is optional. An agent sending_queue absorbs short gateway outages; a gateway queue absorbs backend outages; refused data is loss, not a silent success. The AWS post’s self-metrics — accepted, refused, sent, send-failed, queue size versus capacity — are health signals for that how-to’s “metrics/internal” pipeline, scraped on their stated 10 second interval and exported to CloudWatch. Their alarm examples (queue above 0.8, any send failure, any refused points, export success under 0.99) are sample PromQL, not SLOs.
What the source does not claim (preview, case study, or limits)
The OpenTelemetry pages are evergreen. The AWS article is a July 14, 2026 how-to: EKS 1.31 or later, IRSA, and CloudWatchAgentServerPolicy. Its add-on pin v6.2.0-eksbuild.1 and 1,000-point batch are that manifest, the batch described as fitting a CloudWatch OTLP limit. A shared gateway on an internal NLB is the post’s multi-cluster option. No source defines a Collector CRD. CloudWatch charges apply; the post says to delete the demo.
FAQ
When does an OpenTelemetry gateway need trace-ID sticky routing?
When a processor must see a whole trace or a whole metric series. The gateway doc uses tail sampling as the example: the load-balancing exporter routes on traceID so one Collector applies the policy. The agent doc says the same for tail sampling and for cumulative-to-delta, and it cautions that splitting across gateways is easy to get wrong if backends change.
What do the Collector docs say memory_limiter and batch are for?
memory_limiter is recommended as the first processor on both agents and gateways so high memory applies backpressure instead of killing the process. The sample configs set 512 MiB on an agent and 2048 MiB on a gateway; those numbers are examples. Batching is recommended with smaller, shorter batches on agents and larger, longer batches on gateways.
Is the AWS OpenTelemetry gateway post the same thing as the Collector spec?
No. The July 14, 2026 AWS post is a how-to for an EKS agent DaemonSet plus a gateway Deployment that exports to CloudWatch and scrapes its own health metrics. Prerequisites, the add-on version pin, the 1,000-point batch, and the 0.99 example alarm are that walkthrough. The pattern of agents forwarding OTLP to a gateway comes from the OpenTelemetry docs.
Conclusion
Send OTLP through an optional agent or straight to the gateway pool’s load balancer. Use a load-balancing exporter hop between gateway Collectors only for sticky tail sampling. The 512 MiB and 2048 MiB limits, the 10 percent sample, and the July 14, 2026 AWS 1,000-point batch are examples, not the Collector spec. The pattern is the gateway and agent-to-gateway docs; the AWS post is only that EKS walkthrough. Browse more on the ByteDiagram blog.
Diagram an OpenTelemetry gateway tier
Map agents, a gateway Collector pool, and optional trace-ID sticky tail sampling in ByteDiagram — then review where credentials and sampling actually sit.
Open Diagram Editor