

On October 3, 2026, XDA Developers published I found a free alternative to Microsoft Visio that doesn't compromise on features, Yash Patel's first-person account of moving to draw.io. It is a fair piece, and I agree with most of it. It also made me want to tell the other half of the story: what happens when an architecture diagram has to explain a flow, not just show the boxes.
Full disclosure before anything else: I build ByteDiagram. So read this as a maker's story, not a neutral review. I have tried to be fair to the tools I compete with, and the comparison table near the end uses only facts I could check on each vendor's own pages in October 2026.
The problem started with a diagram that would not explain itself. I had a clean architecture drawing: a client, an API gateway, a few services, a queue and a database. It was correct. But every time I shared it, I still had to get on a call and trace the request path with my cursor, box by box, because a static picture does not tell you what happens first. So I went looking for a free Visio alternative for architecture diagrams that could do one extra thing: show the flow, in order.
What I actually needed from a Visio alternative
My list was short, and I suspect it looks like yours if you write design docs, teach system design, or post architecture explainers:
- Free to start, without a work or school Microsoft account.
- Cloud and tech icons for things like AWS, Azure, Google Cloud, Kafka and Redis, so a box called "queue" looks like a queue.
- A way to show order: step one, then step two, not everything at once.
- Exports that work everywhere: PNG or SVG for docs, PDF for reviews, and something that moves for slides and social posts.
- No lock-in, so my old draw.io files still open and my new diagrams can leave.
Where I started: Visio, Lucidchart and draw.io
Microsoft Visio is the name everyone types into the search box, and for good reason. On Microsoft's Visio plans and pricing page, Visio Plan 1 is $5 per user per month and Visio Plan 2 is $15 per user per month, both paid yearly. Plan 1 is the web app. Plan 2 adds the desktop app. Plan 1 already includes Azure and AWS shapes and Kubernetes shapes for cloud architecture. There is also a lighter Visio web app included in Microsoft 365 commercial plans, but the same page says Visio for the web needs a work or school account, and personal identities such as outlook.com are not supported. For a solo developer, that means there is no free path.
Lucidchart has a real free plan. Lucid's own Lucidchart guide lists it as 3 editable documents, 60 shapes per document and 100 templates, with paid plans at $9 for Individual and $10 for Team. Sixty sounds like plenty until you remember that a Lucid community team member said that lines and text boxes count toward that limit too. A modest microservices diagram with labeled arrows gets there quickly.
draw.io (diagrams.net) is the honest answer to "free Visio alternative" for most people. The draw.io homepage says it is free forever with no sign-up required, the source is Apache 2.0 licensed, and there is real-time collaboration with shared cursors. It has AWS, Azure and GCP shape libraries, a desktop app, and it imports Visio .vsdx files. It even has flow animation on connectors, which you can export as an animated SVG or GIF. If moving dashes along your arrows is all you need, stop reading and use draw.io.
What I wanted went one step further: a diagram that reveals itself one component at a time, on a timeline, so the viewer follows the request the way I would explain it out loud.
My first hour in ByteDiagram
It looked simpler than I expected
You can open the canvas without creating an account. Your work auto-saves in the browser on that device, and if you sign up later, ByteDiagram moves that canvas into your account as your first project. Every canvas has a diagram type, and there are eight: flowchart, system architecture, sequence diagram, data flow or pipeline, mind map, network or cloud infrastructure, state machine, and timeline or roadmap. The type decides which shapes show up in the sidebar, how auto-layout behaves and which templates you see, and you can switch it later from the chip next to the logo. If a blank canvas feels intimidating, the template library is one click away.
Moving things around feels effortless
It is drag and drop: pull a shape or icon onto the canvas, then drag from one node's handle to another to connect them. When my layout got messy, the Auto-arrange button tidied it in one go. Snap to grid, alignment guides, Fit to screen and undo or redo with the usual keyboard shortcuts are all there. None of that is unique, and draw.io and Lucidchart do it well too. What mattered is that it did not slow me down before I got to the part I actually came for.
The diagram finally explains itself
This is the reason ByteDiagram exists. The Timeline menu opens a bottom timeline plus a sequence builder and a timeline builder, where you decide what appears first, what follows, and how long each step takes. Presentation mode lets you step through the diagram with the arrow keys in a meeting. The Export menu has two kinds of GIF: an Animated GIF of the whole diagram with lines in motion, and a Timeline GIF that reveals components one by one. MP4 video export is available on paid plans. If you are signed in, an AI animation option can draft the timeline for you, and you edit it from there. I walk through the whole process in how to create a ByteByteGo-style animated diagram for free.
More than just basic diagrams
Architecture work is rarely one picture. Sequence diagrams for the auth flow, a state machine for an order, a pipeline for CI/CD, a network diagram for the VPC: each of these is its own diagram type with its own shapes and layout. The built-in tech icon catalog is organized into groups such as AWS Services, Azure, Google Cloud, Databases, Messaging and Streaming, and DevOps and Monitoring, which covers most of what I draw. There is also an AI Diagram Assistant: you describe the system in chat, and it draws or edits the diagram on the canvas and drafts an animation timeline. AI needs a free account and uses AI credits, and the free plan includes a small monthly allowance of AI credits. For an example of the level of detail I aim for, see the Apache Kafka architecture diagram post.
I can leave whenever I want
Lock-in was a dealbreaker for me, so ByteDiagram reads and writes draw.io. The File panel imports .drawio or .xml files from diagrams.net, and a multi-page draw.io file comes in with each page as its own page. It exports back to draw.io too, along with ByteDiagram JSON. Static exports are PNG, SVG and PDF. Once you are signed in, you can save to the cloud, open version history, and share an embed link. If you already have a flowchart you like, converting it into an animated diagram is a short job.
Where draw.io, Lucidchart and Visio are still better
I would not trust a comparison that only listed wins, so here is where the others clearly beat ByteDiagram today.
- draw.io is free without caps, open source, and has a desktop app that works offline. It imports .vsdx, Gliffy and Lucidchart files, plus Mermaid and SQL through its text import tools, according to its import formats page. ByteDiagram imports draw.io and JSON only, with no direct Visio import.
- Lucidchart is built for teams: real-time collaboration, comments and version control, data linking to Google Sheets, Excel or Salesforce, and integrations with Jira and Confluence, as Lucid describes in its guide. If your company's process documentation lives there, it is hard to beat.
- Visio owns the Microsoft 365 world. Plan 2 adds BPMN 2.0, P&ID and electrical diagrams, floor plans, AutoCAD file support and data connectivity with two-way sync. If your organization already has Visio in Microsoft 365 and trades .vsdx files, stay there.
- ByteDiagram's own limits: it runs in the browser, with no desktop app. The free plan comes with a small monthly allowance of AI credits and a cap on nodes per diagram, and MP4 export needs a paid plan. ByteDiagram does support real-time collaboration, but if your team lives on comments, data linking and Jira or Confluence integrations, Lucidchart goes further.
Two more tools are worth naming. If you want diagrams as code that live next to your README, GitHub renders Mermaid code blocks right in Markdown. If you want a loose, hand-drawn whiteboard sketch, Excalidraw is an open-source virtual whiteboard built for exactly that.
ByteDiagram vs draw.io vs Lucidchart vs Visio
| Feature | ByteDiagram | draw.io | Lucidchart | Visio |
|---|---|---|---|---|
| Price to start | Free plan; Pro $9/month, Gold $39/month | Free, no sign-up | Free plan; Individual $9/month, Team $10 | Plan 1 $5, Plan 2 $15 per user/month, paid yearly |
| Free tier limits | Small monthly AI credit allowance; per-diagram node cap | No paywalls (Apache 2.0) | 3 editable docs, 60 shapes per doc, 100 templates | Web app included only in Microsoft 365 commercial plans |
| Where it runs | Web browser | Web and desktop app | Web | Web (Plan 1); web and desktop (Plan 2) |
| Cloud architecture icons | AWS, Azure, Google Cloud and more | AWS, Azure, GCP libraries | Network and cloud shape libraries | Azure, AWS and Kubernetes shapes (Plan 1+) |
| Step-by-step timeline reveal | Yes (timeline, sequence builder, presentation mode) | Connector flow animation | Presentation mode | Not listed |
| Animated export | Animated GIF, Timeline GIF; MP4 on paid plans | Animated SVG and GIF of connector flow | Not listed | Not listed |
| Static export | PNG, SVG, PDF, JSON, .drawio | SVG, PNG, PDF | Visio export on paid plans | PNG, JPEG, PDF |
| Import | .drawio / .xml, JSON | .vsdx, Gliffy, Lucidchart, Mermaid, SQL, CSV | Visio import on paid plans | Opens .vsd files from Visio 2000 on; DWG (Plan 2) |
| AI diagram generation | Yes, signed in, uses AI credits | Yes, online editor only | Yes (Lucid AI) | Not listed |
| Real-time co-editing | Yes | Yes, shared cursors | Yes | Yes |
"Not listed" means I could not find the feature on the vendor's current plan or product pages, not that it is impossible. Prices are in USD as published in October 2026 and change often, so check each pricing page before you buy.
Who should use which
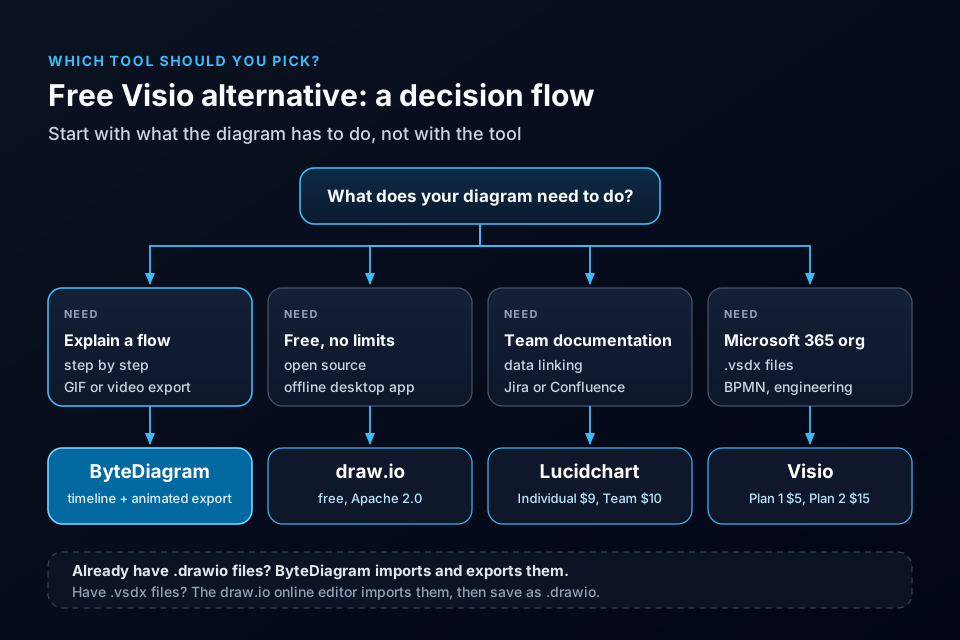
- Pick ByteDiagram if the diagram has to explain a flow: system design explainers, onboarding docs, teaching, interview prep, or architecture posts for LinkedIn and YouTube where a GIF or video beats a still image.
- Pick draw.io if you need static diagrams, zero cost with no limits, an offline desktop app, or you receive Visio files regularly.
- Pick Lucidchart if your team documents processes together and wants data linking and Jira or Confluence integrations, and you are happy to pay per seat.
- Pick Visio if you work inside a Microsoft 365 organization, trade .vsdx files, or need BPMN, P&ID or floor plan templates.
For a wider look at tools built around animation, including Miro, Figma and Canva, see my roundup of the 10 best tools for animated flow diagrams in 2026.
I stopped looking for a replacement
If you only need static boxes and arrows and want to pay nothing, draw.io is the free Visio alternative I would recommend to a friend, and I mean that. But if your architecture diagrams have to explain how a request moves, in what order, to people who were not in the room, that is the gap ByteDiagram fills. Because it imports and exports .drawio files, you do not have to pick one forever. Start in whichever tool you already have, and bring the diagram over when it needs to move.
FAQ
Is there a free alternative to Microsoft Visio for architecture diagrams?
Yes. draw.io is free with no sign-up, Apache 2.0 licensed, and includes AWS, Azure and GCP shape libraries. ByteDiagram has a free plan aimed at architecture diagrams that animate step by step and export as GIF. Lucidchart also has a free plan, limited to 3 editable documents and 60 shapes per document.
Can ByteDiagram open draw.io files?
Yes. ByteDiagram imports .drawio and .xml files from diagrams.net, and each page of a multi-page file comes in as its own page. It can also export a diagram back to draw.io format.
Can I move a Visio diagram into ByteDiagram?
Not directly. ByteDiagram imports draw.io and its own JSON format. The draw.io online editor can import .vsdx files, so one route is to open the .vsdx in draw.io, save it as a .drawio file, and import that into ByteDiagram. How faithfully the shapes carry over depends on the original diagram.
Is ByteDiagram free?
ByteDiagram has a free plan that includes PNG, SVG, PDF and GIF export. MP4 video export and larger AI credit allowances come with the paid plans, starting with Pro at $9 a month; current prices are on the pricing page.
Turn your architecture diagram into a walkthrough
Open the editor, drop in a few tech icons or import a .drawio file, set the order on the timeline, and export your first animated architecture diagram as a GIF. You can start without an account.
Open Diagram Editor