
Every scalable web system eventually places a load balancer between clients and application servers. In system design interviews, on-call runbooks, and architecture reviews, the load balancer is rarely a footnote — it is the component that defines how traffic spreads, how failures are isolated, and how deployments roll forward without dropping users.
This guide walks through the patterns you should understand, the failure modes teams actually hit in production, and how to draw a load balancer architecture diagram that communicates intent in one glance. If you are preparing for interviews or documenting a real service, a clear diagram beats a wall of bullet points.
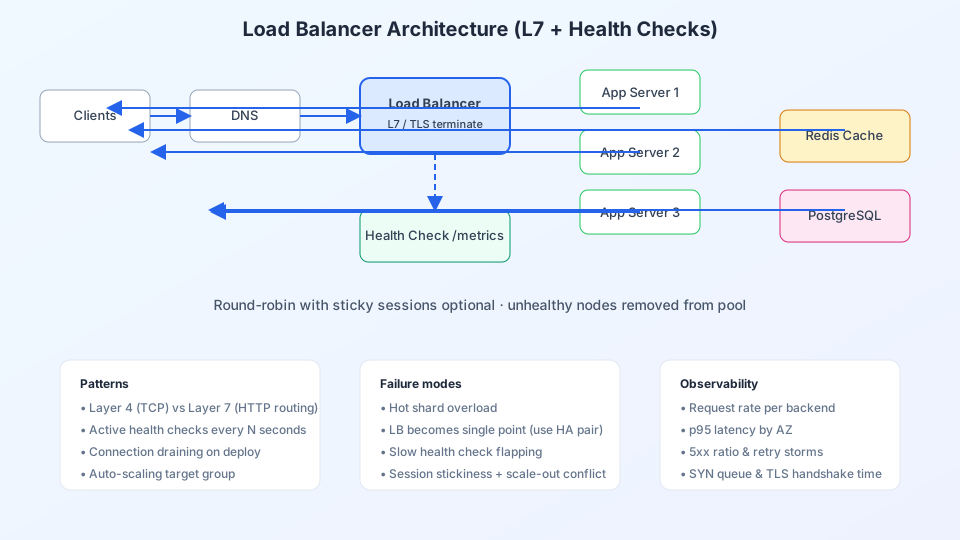
What a load balancer does in the architecture
At a high level, a load balancer accepts incoming connections (or HTTP requests), chooses a healthy backend from a pool, and forwards traffic. That sounds simple, but the implementation layer matters:
- Layer 4 (transport) — routes TCP/UDP flows by IP and port; fast, protocol-agnostic, limited routing logic.
- Layer 7 (application) — understands HTTP paths, headers, cookies, and TLS; enables path-based routing and termination at the edge.
Most modern product APIs use an L7 reverse proxy (NGINX, Envoy, HAProxy, cloud ALB/GLB) in front of stateless app tiers. Static assets often bypass the app entirely via a CDN — a pattern you will also see when mapping eCommerce architecture diagrams, where the edge tier sits left of services.
Core components to show on your diagram
When you diagram load balancer architecture, include these boxes and the direction of request flow:
- Clients — browsers, mobile apps, partner APIs.
- DNS — resolves to the LB VIP or anycast edge; note TTL and failover DNS if relevant.
- Load balancer pair — show HA (active/passive or active/active) so reviewers do not assume a single point of failure.
- Target group / backend pool — N identical app servers or containers.
- Health check path — dashed line from LB to
/healthzor gRPC health service. - Shared dependencies — cache (Redis), primary database, message bus — behind the app tier, not behind the LB.
Diagram rule: one arrow per meaningful hop. Clients → DNS → LB → app → cache/DB. Avoid drawing the database directly from the load balancer unless you operate a connection pooler there (PgBouncer, RDS Proxy).
Load balancing algorithms and when they matter
The algorithm picks which backend receives the next request. Common choices:
| Algorithm | Behavior | Good fit |
|---|---|---|
| Round robin | Cycles through backends in order | Homogeneous, stateless APIs |
| Least connections | Sends to the backend with fewest open connections | Long-lived connections, WebSockets |
| Weighted | More traffic to larger instances | Mixed instance sizes during migration |
| Consistent hash | Same client → same backend (by IP or cookie) | Session stickiness, cache locality |
In interviews, mention that stickiness simplifies some session stores but complicates scale-in and deploys. Prefer external session storage (Redis) plus stateless apps when you can.
Health checks: the hidden contract
Backends leave the pool when health checks fail. Design checks that reflect real readiness:
- Use a lightweight endpoint that verifies critical dependencies (DB ping, cache ping) without heavy work.
- Set intervals and thresholds to avoid flapping — e.g. 3 failures over 30s before removal, 2 successes before re-admission.
- Distinguish liveness (process up) from readiness (can serve traffic) if your platform supports both (Kubernetes probes mirror this idea).
During rolling deploys, enable connection draining so existing sessions finish while new connections go to updated instances. Your diagram can annotate “draining” on old nodes during deploy windows.
TLS termination and security boundaries
Terminating TLS at the load balancer is standard: clients trust the public certificate; internal hops may use mTLS between mesh sidecars. On your diagram, mark where HTTPS ends and HTTP or gRPC starts inside the VPC. Call out WAF or rate limiting at the edge if those protect the pool from abuse.
Failure modes teams should document
- Hot shard — one backend receives disproportionate traffic due to sticky keys or cache misses.
- Retry storms — clients retry 503s, multiplying load; use jittered backoff and limit retries at the gateway.
- LB saturation — CPU on the proxy itself; scale LB capacity or offload TLS to specialized hardware/cloud features.
- Slow health checks — checks that run heavy queries mark all nodes unhealthy simultaneously.
Pair this topic with animated request flow when presenting to non-experts — the same technique used in ByteByteGo-style animated diagrams helps viewers see traffic move client → LB → server → cache.
Practical use cases
- System design interviews — sketch LB + auto-scaling group + DB replica in under five minutes.
- Incident response — highlight which backends failed health checks during an outage postmortem.
- Cost reviews — show when a single regional LB is enough vs. multi-region active-active.
- Platform onboarding — explain why internal tools hit an ingress controller instead of individual pod IPs.
Example prompt for AI diagram generation
In ByteDiagram, describe the full stack so the first draft includes the LB layer explicitly:
Internet users → Route53 DNS → AWS ALB (TLS termination)
→ 3 EC2 app servers in an auto scaling group
→ Redis cache + PostgreSQL primary with read replica
→ health check path /healthz, CloudWatch metrics
Left-to-right layout, NGINX icon on load balancer.
FAQ
When should I use Layer 4 instead of Layer 7?
Choose L4 when you need maximum throughput with minimal inspection (gaming UDP, raw TCP services). Choose L7 when you route by URL, inject headers, or terminate HTTPS at the edge.
Does every microservice need its own load balancer?
Not necessarily. An API gateway or service mesh ingress often fronts many services. Diagram the gateway as the public LB and show internal L4 balancing between mesh sidecars if that matches your platform.
How do CDNs relate to load balancers?
CDNs cache static content close to users. Dynamic API traffic still hits your origin LB. Many architecture diagrams place CDN left of the LB for cacheable assets only — see our animated diagram guide for sequencing those layers in a presentation.
Conclusion
Load balancer architecture is about more than distributing requests — it is where you enforce health, TLS, routing, and graceful deploy behavior. A precise diagram anchors discussions in interviews and production. Start with clients, DNS, HA load balancers, a backend pool with health checks, and shared data tiers; then annotate algorithms, stickiness, and failure modes that matter for your system.
Diagram your load balancer architecture
Use ByteDiagram to generate LB + backend pool layouts with tech icons, then animate request flow for interviews or docs.
Open Diagram Editor