
An ER (entity-relationship) diagram is the map of your database: which tables exist, which columns identify each row, and how the tables point at each other. Here is how to create an ER diagram a developer can build from, whether you are designing a new schema or documenting an existing one.
We use one small online shop database with five tables. Every code block is the exact text we ran on 9 October 2026 (IST): a Mermaid erDiagram rendered through mermaid.ink, and a CREATE TABLE script turned into a diagram with the DBML CLI and Kroki. Where something failed, we show the failure and the fix.
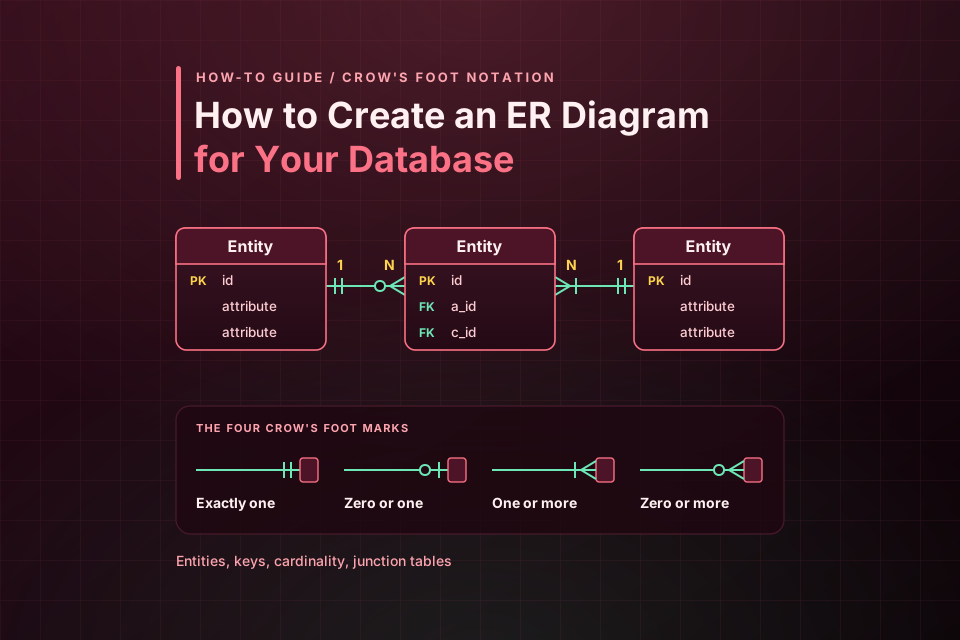
The short version, in seven steps:
- List the entities your database stores.
- Add attributes and primary keys to each entity.
- Connect relationships and set cardinality at both ends.
- Resolve many-to-many with a junction table.
- Run normalization checks (1NF, 2NF, 3NF).
- Draw the ER diagram from text with Mermaid.
- Generate an ER diagram from an existing SQL schema.
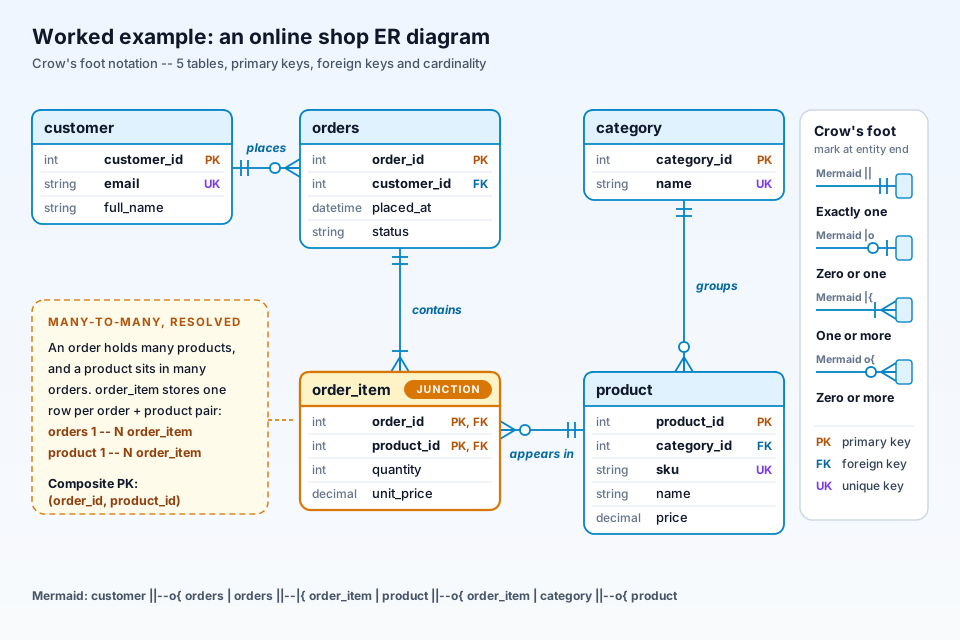
The diagram above is the finished worked example in crow's foot notation. It has the same tables, keys and relationships as the Mermaid code in Step 6.
What an ER diagram shows
An ER diagram has four parts. Entities are the things you store, and usually become tables. Attributes are facts about an entity, and become columns. Relationships link entities, such as a customer placing an order. Cardinality says how many of one entity can relate to the other, and whether zero is allowed.
ER models are commonly built at three levels: conceptual (main entities and links), logical (adds attributes and keys, product-neutral) and physical. This guide works at the logical-to-physical level.
An ER diagram shows how your data is structured, not how your system runs. Services, queues and network calls belong in an architecture diagram; our guide to turning a text description into an architecture diagram covers that kind.
Crow's foot vs Chen notation
Two notations you will commonly meet are Chen notation, from Peter Chen's 1976 paper that introduced the entity-relationship model, and crow's foot notation:
| Element | Chen notation | Crow's foot notation |
|---|---|---|
| Entity | Rectangle | Box with a name header |
| Attribute | Oval joined to its entity by a line; key attributes underlined | Listed as rows inside the entity box, often tagged PK, FK or UK |
| Relationship | Diamond between the entities | A line between the boxes, usually with a short verb label |
| Cardinality | Shown on the connecting lines, for example a double line for total participation | Marks at each end of the line: bar for one, circle for zero, three-pronged foot for many |
| Typical use | Commonly used in teaching and conceptual models | Typically used for designing and documenting real database tables |
For database work, use crow's foot: its boxes map onto tables and columns, keys sit next to their columns, and Mermaid draws it directly. Chen still suits a whiteboard sketch before the tables exist.
The worked example: a small online shop database
We will build the data model for a small online shop. It has five entities:
- customer: a person with an account.
- orders: one checkout by one customer.
- order_item: one product line inside one order (the junction table).
- product: something the shop sells.
- category: a group of products, such as "Books".
The rules: a customer places zero or more orders; an order contains one or more order items; a product appears in zero or more order items; a category groups zero or more products. For how the same online shop looks as an architecture diagram, see that guide; here we stay at table level.
Step 1: List the entities
Underline the nouns in your requirements that the system has to remember. "A customer places an order for products in a category" gives you customer, order, product and category. Then filter:
- Keep nouns with several facts of their own and many instances.
- Demote nouns that are only a single fact about something else. "Email" is an attribute of customer, not an entity.
- Name them consistently. Singular names are a common convention. We broke it once on purpose:
orders, becauseORDERis a reserved word in SQL.
That gives four entities. The fifth, order_item, appears in Step 4.
Step 2: Add attributes and primary keys
For each entity, list the facts you need to store, then choose a primary key (PK): the column whose value is unique for every row and should not change. An integer ID such as customer_id is the usual choice, because values like email addresses can change.
Mark a unique key (UK) wherever the business needs a second value to stay unique: customer.email, product.sku and category.name. A UK is not the identifier, but the database should still refuse duplicates.
Keep one value per column. Hold back foreign keys until the next step; adding them first is how they end up on the wrong table.
Step 3: Connect relationships and set cardinality
Draw a line per business rule and set cardinality at both ends. Each end carries two marks: the inner one is the minimum, the outer one the maximum, which is how the Mermaid docs describe its two-character tokens:
| Meaning | Crow's foot mark | Mermaid (left side) | Mermaid (right side) |
|---|---|---|---|
| Exactly one | Two bars | || |
|| |
| Zero or one | Circle and bar | |o |
o| |
| One or more | Bar and crow's foot | }| |
|{ |
| Zero or more | Circle and crow's foot | }o |
o{ |
Read each line from the first entity: customer ||--o{ orders says one customer places zero or more orders, and each order belongs to exactly one customer. The foreign key always goes on the "many" side, so orders gets customer_id FK, and product gets category_id FK.
Mermaid also distinguishes identifying relationships, drawn as solid lines with --, from non-identifying ones, drawn as dashed lines with ... A relationship is identifying when the child cannot exist without the parent, typically because the parent's key is part of the child's primary key. We used solid lines throughout for simplicity; strictly, only the two links into order_item are identifying.
Step 4: Resolve many-to-many with a junction table
One rule does not fit a single line: an order holds many products, and a product appears in many orders. That is many-to-many, and no single foreign key can store it. The fix is a junction table between them.
Our junction table is order_item. Its primary key is the composite (order_id, product_id), and each part is also a foreign key, which is why both columns are tagged PK, FK (the Mermaid docs allow several keys on one attribute, separated by a comma). The single many-to-many line becomes two one-to-many lines:
orders ||--|{ order_item: every order has at least one line item.product ||--o{ order_item: a product may never have been ordered.
Facts about the pairing live here too: quantity and unit_price describe this product in this order. The composite key allows each product once per order, so a second unit raises the quantity.
Step 5: Run normalization checks
Normalization catches duplicated data before it becomes a bug. Ask one question per normal form:
- 1NF: is every column a single value? No repeating groups such as
product1,product2, and no lists in a column. Our order lines live inorder_itemrows, so we pass. - 2NF: does every non-key column depend on the whole key? This matters for composite keys. Copying
product.nameintoorder_itemwould make it depend onproduct_idalone, which breaks 2NF. - 3NF: does any non-key column depend on another non-key column? A customer email stored on
orderswould depend oncustomer_id, not the order. Look it up through the foreign key instead.
Now the interesting case: order_item.unit_price looks like a copy of product.price, which would depend on product_id alone. It is not. product.price is today's price; unit_price is the price paid when the order was placed, and old orders must not change when the catalogue does. It depends on the order and product together, so it passes 2NF. Keep a note on deliberate snapshots like this so nobody "fixes" them.
Step 6: Draw the ER diagram from text with Mermaid
A text diagram lives in your repository and changes in the same commit as a migration. This is our complete Mermaid erDiagram, exactly as rendered:
erDiagram
    customer ||--o{ orders : places
    orders ||--|{ order_item : contains
    product ||--o{ order_item : "appears in"
    category ||--o{ product : groups
    customer {
        int customer_id PK
        string email UK
        string full_name
    }
    orders {
        int order_id PK
        int customer_id FK
        datetime placed_at
        string status
    }
    order_item {
        int order_id PK, FK
        int product_id PK, FK
        int quantity
        decimal unit_price
    }
    product {
        int product_id PK
        int category_id FK
        string sku UK
        string name
        decimal price
    }
    category {
        int category_id PK
        string name UK
    }
What we ran: on 9 October 2026 (IST) we URL-safe base64-encoded that code and requested https://mermaid.ink/svg/<encoded code>. mermaid.ink returned HTTP 200 with an SVG ER diagram, and its PNG endpoint (/img/<encoded code>?type=png) also returned HTTP 200. It showed all five entities, every key tag, the four relationship labels and crow's foot ends matching the code. No account was needed.
To render locally instead, the Mermaid CLI README shows the basic command mmdc -i input.mmd -o output.svg. We did not run the CLI for this post. Mermaid picks its own layout, so boxes will not sit where our illustration puts them. If you are still choosing a text format, our article on text-based diagram tools such as Mermaid and PlantUML compared for sequence diagrams covers the trade-offs. If you prefer dragging boxes, we cover free Visio alternatives such as draw.io and Lucidchart, but have not checked their ER features.
AI tools can draft an erDiagram too (see our hands-on test of AI diagram generators); run Steps 3 to 5 on whatever they return. We did not test AI drafting here.
Step 7: Generate an ER diagram from an existing SQL schema
If the database exists, generate the diagram from the schema so it matches what is deployed. We saved this PostgreSQL DDL as shop.sql:
CREATE TABLE category (
  category_id SERIAL PRIMARY KEY,
  name VARCHAR(100) NOT NULL UNIQUE
);
CREATE TABLE customer (
  customer_id SERIAL PRIMARY KEY,
  email VARCHAR(255) NOT NULL UNIQUE,
  full_name VARCHAR(200) NOT NULL
);
CREATE TABLE product (
  product_id SERIAL PRIMARY KEY,
  category_id INT NOT NULL REFERENCES category(category_id),
  sku VARCHAR(40) NOT NULL UNIQUE,
  name VARCHAR(200) NOT NULL,
  price NUMERIC(10,2) NOT NULL
);
CREATE TABLE orders (
  order_id SERIAL PRIMARY KEY,
  customer_id INT NOT NULL REFERENCES customer(customer_id),
  placed_at TIMESTAMP NOT NULL DEFAULT now(),
  status VARCHAR(20) NOT NULL
);
CREATE TABLE order_item (
  order_id INT NOT NULL REFERENCES orders(order_id),
  product_id INT NOT NULL REFERENCES product(product_id),
  quantity INT NOT NULL CHECK (quantity > 0),
  unit_price NUMERIC(10,2) NOT NULL,
  PRIMARY KEY (order_id, product_id)
);
Then we installed the DBML CLI (@dbml/cli 10.3.1, on Node.js 20.19.2; the docs ask for Node.js 18 or higher) and converted the SQL to DBML, a text format for schemas:
npm i @dbml/cli
npx sql2dbml shop.sql --postgres -o shop.dbml
It printed "Generated DBML file from SQL file (PostgreSQL): shop.dbml". This is the complete output:
Table "category" {
  "category_id" SERIAL [pk, increment]
  "name" VARCHAR(100) [unique, not null]
}

Table "customer" {
  "customer_id" SERIAL [pk, increment]
  "email" VARCHAR(255) [unique, not null]
  "full_name" VARCHAR(200) [not null]
}

Table "product" {
  "product_id" SERIAL [pk, increment]
  "category_id" INT [not null]
  "sku" VARCHAR(40) [unique, not null]
  "name" VARCHAR(200) [not null]
  "price" NUMERIC(10,2) [not null]
}

Table "orders" {
  "order_id" SERIAL [pk, increment]
  "customer_id" INT [not null]
  "placed_at" TIMESTAMP [not null, default: `now()`]
  "status" VARCHAR(20) [not null]
}

Table "order_item" {
  "order_id" INT [not null]
  "product_id" INT [not null]
  "quantity" INT [not null, check: `quantity > 0`]
  "unit_price" NUMERIC(10,2) [not null]

  Indexes {
    (order_id, product_id) [pk]
  }
}

Ref:"category"."category_id" <? "product"."category_id"

Ref:"customer"."customer_id" <? "orders"."customer_id"

Ref:"orders"."order_id" <? "order_item"."order_id"

Ref:"product"."product_id" <? "order_item"."product_id"
It kept all five tables, the keys, unique, not null, the CHECK, the composite primary key (as an Indexes entry) and all four foreign keys as Ref lines.
What failed. We posted shop.dbml to Kroki's DBML endpoint:
curl -H 'Content-Type: text/plain' --data-binary @shop.dbml https://kroki.io/dbml/svg -o shop-erd.svgKroki returned HTTP 400 with this error:
Error 400: SyntaxError: Could not parse input at line 38:31. Expected "\"", [a-zA-Z0-9_], or space but "?" found.
Line 38 is the first Ref line, and the character it rejects is the ? in <?. The DBML syntax docs say < means one-to-many and that adding ? to a side of an operator makes that side optional, meaning the foreign key column is nullable. Kroki's DBML renderer did not accept that form.
The edit. We replaced <? with < on the four Ref lines and changed nothing else. Before:
Ref:"category"."category_id" <? "product"."category_id"
Ref:"customer"."customer_id" <? "orders"."customer_id"
Ref:"orders"."order_id" <? "order_item"."order_id"
Ref:"product"."product_id" <? "order_item"."product_id"
After:
Ref:"category"."category_id" < "product"."category_id"
Ref:"customer"."customer_id" < "orders"."customer_id"
Ref:"orders"."order_id" < "order_item"."order_id"
Ref:"product"."product_id" < "order_item"."product_id"
Plain < is a standard one-to-many reference, and it fits this schema: every foreign key in shop.sql is NOT NULL. If yours are nullable, the edit hides that, so note it separately.
The result. The same command with the edited file returned HTTP 200 and a valid SVG: all five tables with column types, primary keys in bold and four relationship lines. Note that Kroki's DBML renderer labels line ends 1 and * rather than drawing crow's feet, and asking it for PNG returned HTTP 400 ("Must be one of svg").
The DBML CLI also documents db2dbml, which reads a schema from a live database connection: documented, not tested by us.
Common ER diagram mistakes
- Leaving many-to-many unresolved. A crow's foot at both ends of one line cannot become a table. Add the junction table first.
- Putting the foreign key on the wrong side of a one-to-many. The foreign key goes on the "many" side.
customer_idgoes onorders, not a list of order IDs oncustomer. - Missing optionality. "One to many" is only half the answer. Decide whether each end's minimum is zero or one; that decides whether the foreign key can be null.
- Putting junction attributes on the wrong table.
quantitydescribes one product in one order, so it belongs onorder_item. - Using ORDER as a table name. The PostgreSQL docs list
ORDERas a reserved key word in PostgreSQL and in the SQL standard. A table calledordermust be quoted in queries, so pickorders.
Where our product fits
ByteDiagram (our product, not tested by us for ER diagrams). It is made by us, so read this as a disclosure, not a review. Its homepage lists eight diagram types: flowcharts, architecture, sequence, pipelines, mind maps, network, state machines and timelines. ER diagrams are not among them, and we have not tested it for ER diagrams, so use Mermaid or the DBML route above for the diagram itself. Architecture is on that list, so it is an option when you also want to show where this database sits next to your services.
FAQ
What is the difference between crow's foot and Chen notation?
Chen notation, from Peter Chen's 1976 paper, draws entities as rectangles, relationships as diamonds and attributes as ovals; it is commonly used for teaching and conceptual models. Crow's foot draws each entity as a box with its attributes inside and shows cardinality with marks at the line ends, so it typically fits real database tables better. Mermaid's erDiagram uses crow's foot.
Can I generate an ER diagram from an existing SQL schema?
Yes. Convert your CREATE TABLE file to DBML with the DBML CLI (sql2dbml shop.sql --postgres -o shop.dbml), then render the DBML, for example through Kroki. In our 9 October 2026 run with @dbml/cli 10.3.1, Kroki rejected the CLI's <? operator with HTTP 400; after we replaced <? with < it returned HTTP 200 and a diagram of all five tables.
How do you show a many-to-many relationship in an ER diagram?
Add a junction table. In our shop, orders and products are many-to-many, so order_item sits between them with a composite primary key (order_id, product_id), each part also a foreign key. One many-to-many line becomes two one-to-many lines: orders ||--|{ order_item and product ||--o{ order_item. Facts about the pairing, such as quantity, go on the junction table.
Sources
All pages were checked on 9 October 2026 (IST).
- Mermaid: Entity Relationship Diagrams (syntax docs): crow's foot notation, cardinality tokens, identifying vs non-identifying lines, PK/FK/UK keys and comma-separated multi-keys.
- mermaid.ink: the hosted render service we used for the Mermaid example.
- Mermaid CLI on GitHub: local rendering with mmdc (documented, not run for this post).
- DBML CLI docs: sql2dbml and db2dbml commands, Node.js 18 or higher.
- DBML syntax docs: relationship operators (<, >, -, <>), the optional ? modifier, composite primary keys in Indexes.
- Kroki: the hosted render service we used for the DBML example.
- Kroki docs: encode a diagram: how Kroki accepts diagram source.
- PostgreSQL docs: SQL Key Words (Appendix C): ORDER listed as a reserved key word.
- Wikipedia: Entity-relationship model: Chen's 1976 paper, Chen notation shapes, crow's foot notation, conceptual, logical and physical models.
- Peter Pin-Shan Chen, “The Entity-Relationship Model: Toward a Unified View of Data”, ACM Transactions on Database Systems, 1976: original paper (cited via Wikipedia; the publisher page blocked our fetch).
- Our homepage (bytediagram.com): the list of eight diagram types.
Draw the system around your database
Your ER diagram shows the tables. To show the services, queues and data stores around them, start an architecture diagram in our editor.
Open Diagram Editor