
You have a system in a README or design doc and want a diagram of it without dragging boxes around. This guide shows a text to architecture diagram AI workflow that works with any AI tool that can write diagram code: describe the system, generate a draft, check it, clean it up and export it. We ran every step for real on 8 October 2026 (IST) with an AI chat tool (Duck.ai, model shown as GPT-6 Luna, free, no sign-in). The prompt, raw output and fixes are below. Disclosure: ByteDiagram is our product; it appears once as an option we did not test.
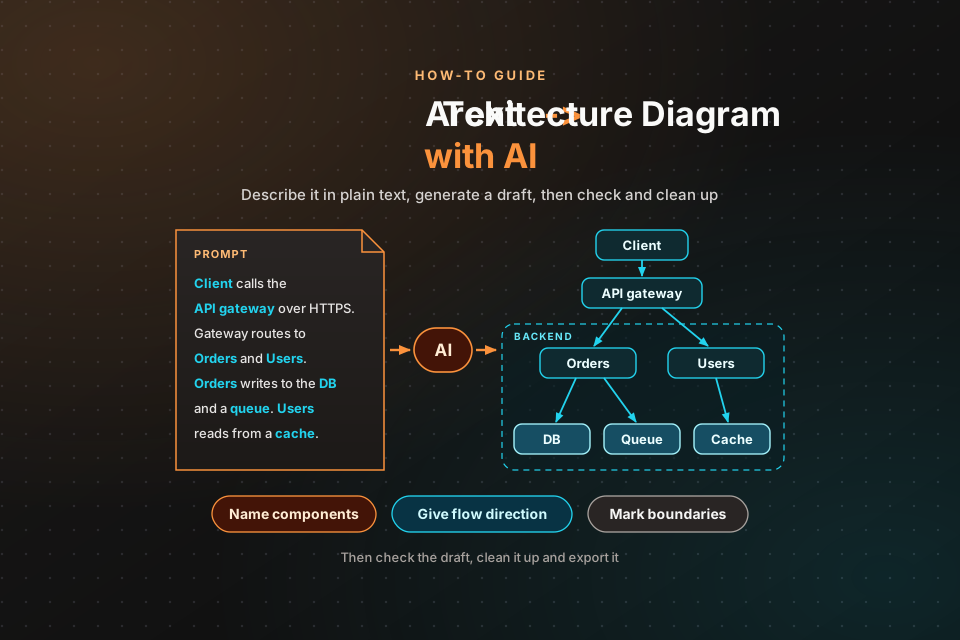
The short version:
- Describe the system in text: components, connections with direction and protocol, and boundaries.
- Generate one diagram per prompt, as code (for example Mermaid) so you can edit and diff it.
- Check the draft against your system: invented components, missing edges, wrong arrow directions.
- Clean up grouping, flow direction, labels and shapes.
- Export SVG or PNG for docs, keep the text source in the repo, and regenerate when the system changes.
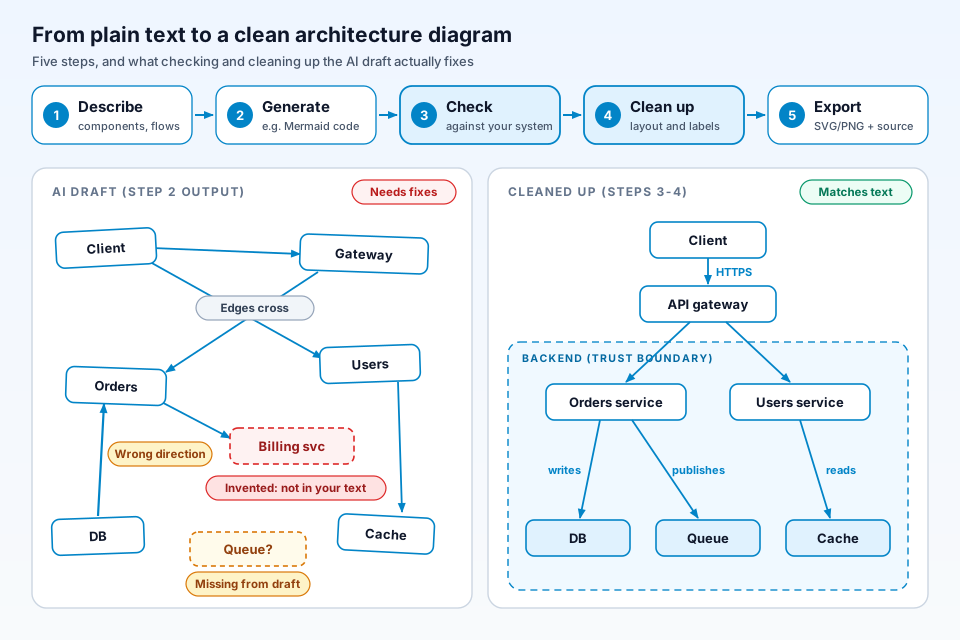
The illustration above shows the five steps and the kinds of problems the check step catches, such as an invented service, a reversed arrow or a missing queue. It is a generic example, not our test run's output; our run's actual problems are in Step 3. If you are still choosing a tool, start with our tested comparison of AI diagram generators; this page is about the method.
What you need before you start
Write down three things before you open any AI tool:
- A component list. Every box you want on the diagram, named the way your team says it ("Checkout service", not "order handler thing").
- The main flows. Who calls whom, in which direction, and over what (HTTPS, REST, gRPC, an event on a queue). One line per connection.
- Boundaries. Which components sit inside a VPC, cluster or trust boundary, and which stay outside it.
You also need somewhere to see the result. If you ask for Mermaid, any Mermaid renderer works: we used mermaid.ink, Kroki and the official Mermaid CLI (mmdc).
Step 1: Write the text description
Most of the quality comes from the description. Keep components, connections and groups as separate parts, give each connection a direction and a protocol or verb, and describe one flow at a time. For a worked component list, see our guide to designing an e-commerce architecture diagram.
Copy-paste prompt template
Create a Mermaid flowchart (flowchart LR) architecture diagram for this system.
Components: [every box, using the exact names you want on the diagram].
Connections: [A] calls [B] over [protocol]; [B] reads from [C];
  [D] writes [what] to [E]; [F] publishes [event] to [queue];
  [worker] consumes from [queue].
Groups: put [components] inside a subgraph called [boundary name].
  Keep [components] outside it.
Use one diagram only. Do not add components that are not listed.
Return only the Mermaid code in one code block, starting with the flowchart line.
Three additions were not in the prompt we ran: the “Keep [components] outside it” line, the rule “Do not add components that are not listed” and the “in one code block, starting with the flowchart line” wording. The last comes straight from our test, where part of the code landed outside the code block.
Filled example (the exact prompt we ran)
Create a Mermaid flowchart (flowchart LR) architecture diagram for this system. Components: Web client, API gateway, Auth service, Catalog service, Checkout service, PostgreSQL database, Redis cache, and a message queue that delivers events to a Notification worker. Connections: Web client calls API gateway over HTTPS; API gateway routes to Auth, Catalog and Checkout over REST; Catalog reads from Redis cache and falls back to PostgreSQL; Checkout writes orders to PostgreSQL and publishes an OrderPlaced event to the queue; Notification worker consumes from the queue. Group the three services and the worker inside a subgraph called Private VPC. Use one diagram only. Return only the Mermaid code.It names nine components, gives each connection a protocol or verb, says what belongs in the Private VPC group, and asks for one diagram. The same structure works for tools that draw directly instead of writing code; here is an example prompt for a RAG architecture diagram written that way.
Step 2: Generate the first draft
Ask for one diagram per prompt, and ask for diagram-as-code such as Mermaid whenever you want something you can edit, review in a pull request and render again.
We pasted the filled example into Duck.ai at about 08:57 IST on 8 October 2026 (model shown as GPT-6 Luna, default settings, free, no sign-in). The output, exactly as returned:
flowchart LR
WebClient[Web client] -->|HTTPS| APIGateway[API gateway]

subgraph Private VPC
    Auth[Auth service]
    Catalog[Catalog service]
    Checkout[Checkout service]
    NotificationWorker[Notification worker]
end


APIGateway -->|REST| Auth
APIGateway -->|REST| Catalog
APIGateway -->|REST| Checkout


Catalog -->|Read| Redis[(Redis cache)]
Catalog -->|Cache miss fallback| PostgreSQL[(PostgreSQL database)]


Checkout -->|Write orders| PostgreSQL
Checkout -->|OrderPlaced event| Queue[(Message queue)]
Queue -->|Consume events| NotificationWorker
One quirk matters straight away: the first two lines, flowchart LR and the WebClient to APIGateway edge, came back as plain text outside the code block, so the model did not fully follow "Return only the Mermaid code" and the copy button would have missed both lines. We tested the copied text alone: mermaid.ink returned HTTP 400 ("Unknown diagram error"), Kroki returned HTTP 400 ("No diagram type detected"), and the Mermaid CLI failed with the same error. Mermaid's syntax reference explains why: every diagram has to begin with its diagram type. Always copy the whole reply and check the first line.
Option: ByteDiagram AI (our product, not tested by us)
ByteDiagram is our product. Its homepage says its AI can help you "create diagrams from text descriptions or existing code", and architecture is one of its eight diagram types. We did not test it for this guide. The AI generator needs a sign-in and we had no test account, so we show no output or screens. On the live pricing page (checked 8 October 2026), the Free plan lists 2 AI credits per month and GIF export, with video export not included; Pro is $9/month and lists video export; Gold is $39/month.
Step 3: Check the draft against your system
First, render the raw output as-is. With the two stray lines included, it rendered without errors on mermaid.ink (HTTP 200, SVG and PNG), on Kroki (HTTP 200, SVG and PNG) and in Mermaid CLI 12.0.0 (Mermaid 12.1.0). The layouts were not the same: Kroki and the CLI placed the data stores in a column to the right, while mermaid.ink drew them below the VPC box with long, crossing edges. Render in the tool you will publish with.
Then check the draft line by line against your text:
- Invented: any box or edge you did not ask for.
- Missing: every component and connection should appear exactly once.
- Direction: requests go caller to callee; events go producer to queue to consumer.
What we found in our run:
- Components: all nine are present (Web client, API gateway, Auth, Catalog and Checkout services, PostgreSQL, Redis, the message queue and the Notification worker). Nothing was invented.
- Edges: all nine requested connections are present, including the "Cache miss fallback" edge to PostgreSQL and the
OrderPlacedevent. None missing, none extra, none reversed. - Grouping: the three services and the worker are inside the VPC group as asked; the gateway, Redis, PostgreSQL and the queue are outside it.
- Problems: the stray lines outside the code block; a group title with a space but no ID (
subgraph Private VPC), which renders but leaves you with an auto-generated ID you cannot reference; the queue drawn with the same cylinder shape as the two databases; and the fallback path drawn exactly like the normal read path.
So the draft was accurate but rough. We saw no invented parts here, but a vaguer prompt leaves the model more to guess, which is why checking is its own step. To judge coverage for a specific platform, compare with a reference such as what a finished Kubernetes architecture diagram should include.
Step 4: Clean up layout, labels and icons
Fixing short code by hand is quicker than re-prompting. Our cleaned version:
flowchart LR
    WebClient[Web client] -->|HTTPS| APIGateway[API gateway]

    subgraph vpc["Private VPC"]
        Auth[Auth service]
        Catalog[Catalog service]
        Checkout[Checkout service]
        NotificationWorker[Notification worker]
    end

    subgraph data["Data stores"]
        Redis[(Redis cache)]
        PostgreSQL[(PostgreSQL database)]
    end

    Queue@{ shape: h-cyl, label: "Message queue" }

    APIGateway -->|REST| Auth
    APIGateway -->|REST| Catalog
    APIGateway -->|REST| Checkout

    Catalog -->|read| Redis
    Catalog -.->|on cache miss| PostgreSQL

    Checkout -->|write orders| PostgreSQL
    Checkout -->|OrderPlaced event| Queue
    Queue -->|deliver event| NotificationWorker
What changed, and why:
- Header back in place.
flowchart LRand the client-to-gateway edge are part of the code. - Subgraph with an ID and a quoted title.
subgraph vpc["Private VPC"]follows the explicit-ID form in the Mermaid flowchart docs, so the group can be referenced later. - Data stores grouped. Redis and PostgreSQL sit in a Data stores group.
- Queue has its own shape. We used Mermaid's horizontal-cylinder shape (
h-cyl, one of the expanded shapes the docs list for v11.3.0 and later) so the queue no longer looks like a database. - Fallback is dotted.
-.->with the label "on cache miss" shows that the PostgreSQL read is conditional.
The cleaned code rendered without errors on mermaid.ink, Kroki and the Mermaid CLI. But Mermaid chooses the layout: in Kroki and the CLI the "read" and "on cache miss" labels next to the Catalog service overlapped, and mermaid.ink put the data stores above the VPC box. Grouping and short labels help; pixel control is not on offer. Setting direction inside a subgraph will not help here, because the docs note that a subgraph's direction is ignored when its nodes link to anything outside it.
On icons: a plain Mermaid flowchart draws text shapes, not product logos. If you need technology icons, rebuild the cleaned structure in a tool with an icon library and keep the Mermaid file as the record of what connects to what.
Step 5: Export and keep it in sync
Export SVG for docs and wikis and PNG for slides or tools that reject SVG. The Mermaid CLI README describes turning a Mermaid file into SVG, PNG or PDF:
mmdc -i cleaned.mmd -o cleaned.svg
mmdc -i cleaned.mmd -o cleaned.png -s 2 -b white
Then keep the text, not just the picture: commit the .mmd file next to the code or docs it describes, so a renamed service shows up in the diff, and regenerate the images whenever it changes. After big system changes, update the description and run the prompt again. To walk an audience through the flow, our guide to animating the diagram after export picks up from here.
Prompt mistakes that produce bad architecture diagrams
- Naming categories instead of components. "Some microservices and a database" invites the model to invent services. Name each one.
- Connections without direction. "Checkout and PostgreSQL are connected" gives you an arrow that may point either way. Say who writes to whom.
- No boundary rules. If you do not say what goes inside the VPC or cluster, and what stays out, the grouping is a guess.
- Several diagrams in one prompt. Ask for each view separately.
- Trusting "return only the code". Our run showed it can be partly ignored; ask for one code block starting with the diagram type, and check anyway.
- Forcing call order into a box diagram. If the order of calls matters most, consider drawing request/response order as a sequence diagram instead.
FAQ
What should an architecture diagram prompt include?
Every component, using the name you want on the diagram; every connection with its direction and its protocol or verb (calls over HTTPS, reads from, publishes to); any grouping or trust boundary, plus what stays outside it; the output format, such as a Mermaid flowchart with left-to-right flow; and a request for one diagram only. Adding "do not add components that are not listed" gives you a clear rule to check the draft against.
Can AI-generated architecture diagrams be edited after generation?
Yes, if you ask for diagram-as-code. Mermaid output is plain text, so you can rename a node, fix an arrow or regroup services in any editor and render it again. In our test we fixed the subgraph, grouped the data stores, changed the queue shape and marked the cache-miss path by hand, then re-rendered. A diagram that only exists as an image is harder to change, and you usually end up regenerating it.
Should I store the diagram as text or as an image?
Keep both, with the text as the source. Commit the .mmd file next to the code or docs it describes, so changes show up in diffs and reviews, and export an SVG or PNG for places that cannot render Mermaid. When the system changes, edit the text and export again instead of editing the image.
Turn your description into a diagram
Start from the text you already have. ByteDiagram is our product: its Free plan lists 2 AI credits per month and GIF export.
Open Diagram Editor