
A system design diagram in an interview is less a finished drawing and more a record of your reasoning. In most interviews, how tidy the boxes look matters less than whether you build the diagram in a sensible order and explain each choice as you draw it.
Here is an eight-step order you can reuse on any prompt, applied to one classic prompt, a URL shortener. It ends with the design as Mermaid code that we rendered on 9 October 2026 (IST), so you can rebuild it. Every traffic or storage number below is an example assumption, not real-world data.
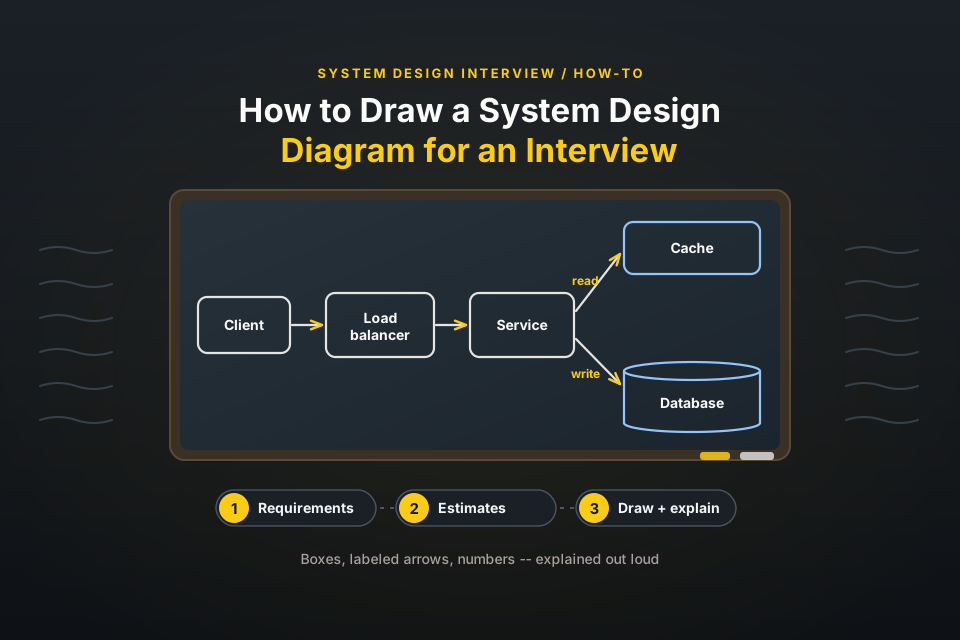
How to draw a system design diagram in an interview, in eight steps:
- Clarify requirements before you draw.
- Estimate scale with back-of-the-envelope numbers.
- Draw the core components and the API.
- Trace the data flow for reads and writes.
- Choose storage and show the data model.
- Scale the design and remove bottlenecks.
- Call out trade-offs and failure points on the diagram.
- Walk the interviewer through the final diagram.
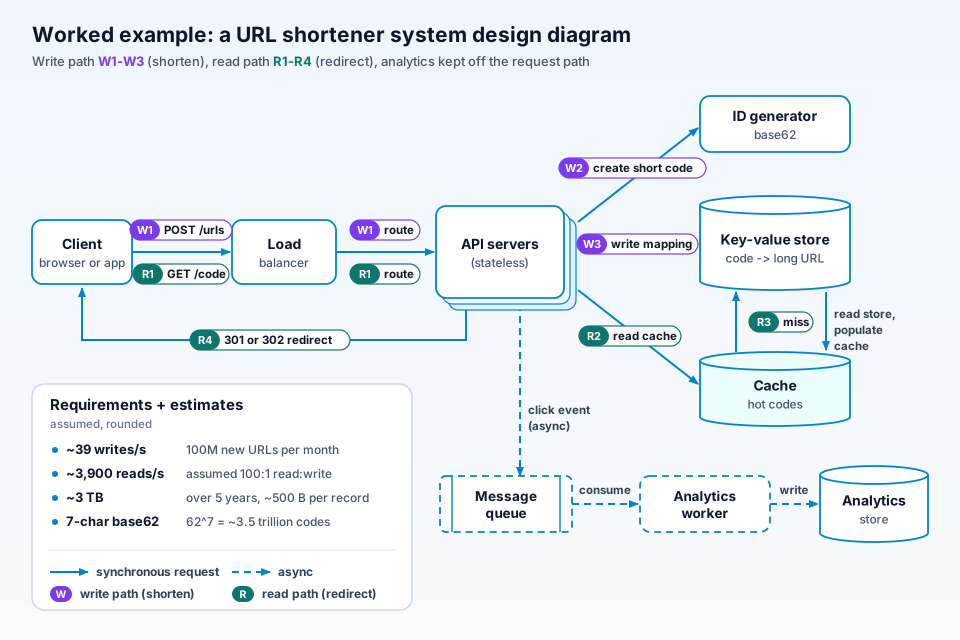
The diagram above is where the worked example ends up: write path W1 to W3, read path R1 to R4, async analytics dashed, and the assumed estimates in a side panel.
What a system design diagram is in an interview
It is a high-level design: boxes are components (clients, load balancers, services, caches, datastores, queues), arrows are requests or data moving between them, and labels on the arrows say what moves and how (an HTTP call, a write, an async event).
Detailed diagrams come later, and only if asked. A sequence diagram shows one request step by step (see sequence diagram tools for drilling into one request), and an ER diagram shows the database schema. The C4 model frames this as hierarchical diagrams, from system context down to code; in an interview you usually stay near the top.
The worked example: design a URL shortener
A typical way an interviewer might phrase it: "Design a URL shortener. Users paste a long URL and get a short link; anyone who opens the short link is redirected to the original. We would also like basic click counts."
The core is small (one write, one read), yet it raises real questions: how to generate codes, how to keep redirects fast, and where analytics should live. We will build the system design interview diagram for it step by step.
Step 1: Clarify requirements before you draw
Ask questions first and write the answers in a corner of the board; they are the yardstick for every later decision.
Functional requirements
- Shorten a URL: given a long URL, return a short code.
- Redirect: opening the short link sends the user to the long URL.
- Optional: a custom alias chosen by the user.
- Optional: an expiry date for links.
- Optional: click analytics per link.
Non-functional requirements
- Redirects should be fast, because every click waits for one.
- High availability: a broken short link breaks every page that shared it.
- Reads (redirects) likely far outnumber writes (new links).
- If it matters to the business, codes should not be easy to guess or enumerate.
Then draw only one box: the client. Everything else gets added in the order the requests flow.
Step 2: Estimate scale with back-of-the-envelope numbers
Rough numbers tell you whether you need a cache, sharding or a queue, so say them out loud with the arithmetic. The figures below are example assumptions, rounded for mental math, not real traffic for any service; in an interview, agree the inputs first.
| Assumption | Arithmetic | Result |
|---|---|---|
| 100 million new short URLs per month | 100,000,000 ÷ (30 × 86,400 s) ≈ 38.6 | About 39 writes per second on average |
| Read:write ratio of 100:1 (read-heavy) | 39 × 100 = 3,900 (3,858 before rounding) | About 3,900 redirects per second on average |
| About 500 bytes per record, kept for 5 years | 100,000,000 × 60 months × 500 B = 3 × 10¹² B | About 3 TB of mapping data |
| 7-character base62 codes (a–z, A–Z, 0–9) | 627 = 3,521,614,606,208 | About 3.5 trillion possible codes |
Averages hide peaks, so add "peak could be several times the average". The conclusions matter more than the digits: the system is read-heavy, about 3 TB is a modest dataset, and 60 months use about 6 billion (100 million × 60) of 3.5 trillion codes.
Step 3: Draw the core components and the API
Start with the request path
From the client box, draw an arrow to a load balancer, then to a tier of stateless API servers. Stateless means any server can handle any request, which is what lets you add servers later. Draw it as a stack of boxes.
Name the API next to the arrows
Write the two endpoints on the board, next to the arrows they travel along:
POST /urlswith the long URL in the body returns the short code.GET /{code}returns a redirect to the long URL.
Naming the API early keeps the conversation concrete.
Step 4: Trace the data flow for reads and writes
Add the boxes the API needs, in the order a request touches them, and number the arrows so you can narrate the flow later. These match the detail diagram above.
Write path
- W1: the client sends
POST /urlsthrough the load balancer to an API server. - W2: the API server asks the ID generator to create a short code.
- W3: the API server writes the code-to-URL mapping to the datastore.
Read path
- R1: the client sends
GET /{code}through the load balancer. - R2: the API server reads the code from the cache.
- R3: on a miss, it reads the store and populates the cache (drawn as shorthand between the cache and the store).
- R4: the API server returns a 301 or 302 redirect to the client.
Tip: use solid lines for synchronous requests and dashed lines for anything asynchronous, and put a two-line legend in a corner.
Step 5: Choose storage and show the data model
The core data is a lookup from a code to a long URL, so a key-value store is a common choice: fast reads by key and simple to partition. A relational database can work too, especially if you also need users, unique custom aliases or reporting. Say which you pick and why.
Sketch the record next to the store: code (the key), long_url, created_at, expires_at and owner_id. If the interviewer asks for the schema, sketch the key tables; our guide on how to create an ER diagram for the database behind it covers that in depth.
Generating the short code
Two common approaches:
- Encode a unique ID in base62. A counter or ID service hands out unique numbers, and you convert each to base62. Codes never collide, but sequential IDs are guessable and the ID service must stay available.
- Hash the long URL. Encode a hash and keep 7 characters. No central counter, but truncated hashes can collide, so check and retry.
Step 6: Scale the design and remove bottlenecks
Go back to your numbers and ask what breaks first; here, likely the read path.
Cache hot codes
Popular links are likely clicked again and again, so use cache-aside: read the cache, and on a miss read the store and populate the cache.
Scale out the stateless tier behind the load balancer
Stateless API servers let you add more behind the load balancer as traffic grows. For detail, see our guide to load balancer patterns such as L4 vs L7 and health checks.
Partition or replicate the datastore
Shard the mapping table by code (for example by a hash of the code) so each shard holds part of the data, and add read replicas if reads still outgrow one node per shard.
Move analytics off the request path
Recording a click should not slow a redirect. The API server publishes a click event to a message queue and redirects straight away; an analytics worker writes events to an analytics store. Draw this path dashed.
You may also mention an edge layer in front of the load balancer, since redirects are small responses; see how a CDN edge and origin shield fit in front of your servers. Because redirects are dynamic and tied to analytics, say that it may help rather than that it will.
Step 7: Call out trade-offs and failure points on the diagram
Interviewers typically want to hear that you see more than one option. Note trade-offs next to the boxes:
| Decision | Option A | Option B | What to say |
|---|---|---|---|
| Redirect status | 301 Moved Permanently | 302 Found | RFC 9110 makes a 301 heuristically cacheable, so repeat clicks may never reach your servers and analytics may undercount. A 302 is not heuristically cacheable by default, so clicks are easier to count, at the cost of more server load. |
| Short code | Counter or ID in base62 | Hash of the URL | Counter codes never collide but are guessable and need an ID service; hashes need collision checks. |
| Datastore | Key-value store | Relational database | Key-value fits a code lookup and partitions easily; relational helps with users, aliases and reporting. |
| Analytics | Synchronous write | Async queue and worker | Async keeps redirects fast; counts arrive a little later and the queue is one more part to run. |
| Cache freshness | Long TTL | Short TTL or invalidate on change | Long TTLs mean more hits, but a deleted or expired link may keep redirecting until the entry expires. |
Then mark the single points of failure. Here there are two: the ID generator (run several instances, each with its own ID range) and a single database primary (add replicas with failover; sharding limits what one failure affects).
Step 8: Walk the interviewer through the final diagram
Finish with a short narration of about 30 to 60 seconds, in the same order you built it:
- The requirements, and what you chose to leave out.
- The numbers, and what they told you (read-heavy, about 3 TB).
- The write path, W1 to W3.
- The read path, R1 to R4, including the cache.
- How it scales: more API servers, sharding, async analytics.
- The trade-offs and the single points of failure.
Then invite questions. If a requirement changes, redraw only the part that changes.
The finished URL shortener diagram as code
A text version of your practice design is easy to revise and compare later. This is the URL shortener as a Mermaid flowchart, exactly as rendered:
flowchart LR
    client[Client: browser or app] --> lb[Load balancer]
    lb --> api[API servers - stateless]
    api -->|POST /urls: create short code| idgen[ID generator - base62]
    api -->|write mapping| db[(Key-value store: code to long URL)]
    api -->|GET /code: read| cache[(Cache: hot codes)]
    cache -.->|miss| db
    api -->|301 or 302 redirect| client
    api -.->|click event, async| queue[[Message queue]]
    queue -.-> analytics[Analytics worker]
    analytics -.-> adb[(Analytics store)]
In Mermaid's flowchart syntax, [( )] draws a cylindrical shape (used here for the stores), [[ ]] draws a subroutine shape (used for the queue) and -.-> draws a dotted link (used for the async path and the cache miss). The dotted cache -.->|miss| db arrow is shorthand. In cache-aside, it is the API server that reads the store on a miss and then populates the cache; the detail diagram (R3) compresses this into the two short arrows between the cache and the store.
What we ran: on 9 October 2026 (IST) we URL-safe base64-encoded that code and requested https://mermaid.ink/svg/<encoded code> for an SVG and https://mermaid.ink/img/<encoded code>?type=png for a PNG. Both returned HTTP 200 (image/svg+xml and image/png) and showed all nine components, the edge labels and the dotted async path, laid out left to right. Without ?type=png, the /img/ endpoint returned a JPEG. No account was needed. Mermaid picks its own layout, so boxes sit differently from the detail diagram, but the components are the same.
After a mock interview, you can also turn your interview notes into an architecture diagram with AI and then check it against your own version.
Common system design diagram mistakes in interviews
- Drawing before clarifying. Every later choice becomes a guess.
- Unlabeled arrows. An arrow without a label could be a call, a write or an event.
- No read and write distinction. The two paths have different needs; number them separately.
- A box for every buzzword. If you cannot say why a box is there, leave it out.
- Skipping the numbers. Without estimates you cannot justify a cache, a shard or a queue.
- No trade-offs. One option presented as the only option invites the obvious follow-up.
- A messy board with no legend. Keep a left-to-right flow and a legend for solid and dashed lines. For a bigger domain, see a larger example: mapping an e-commerce system into layers.
The open-source System Design Primer suggests a similar outline for these interviews: outline use cases and constraints, create a high-level design, design the core components, then scale the design.
Where our product fits
ByteDiagram (our product, made by us). It lists architecture among its eight diagram types (flowcharts, architecture, sequence, pipelines, mind maps, network, state machines and timelines), and its homepage says AI can help you "create diagrams from text descriptions or existing code". That makes it one option for redrawing your practice designs after a mock interview. Using it in or for interviews is not tested by us, and in a live interview you will typically use whatever tool the interviewer provides.
FAQ
What should a system design diagram include in an interview?
Typically: the clients, the entry point (often a load balancer), a stateless service tier, the datastores, a cache, and any async queue and workers, joined by labeled arrows that separate the read path from the write path. Beside it, keep a short list of the requirements and the estimates you assumed. Keep it high level unless the interviewer asks you to zoom in on one part.
Should I use a whiteboard or a diagramming tool for a system design interview?
Use whatever the interviewer provides or asks for. Formats vary between companies and between onsite and remote interviews, so check beforehand if you can, and practise on the same kind of surface. Whatever the tool, keep the shapes simple: boxes for services, cylinders for storage and labeled arrows for requests and data.
How much detail should a system design interview diagram have?
Start with a high-level diagram; as a rough guideline, around 5 to 10 boxes is usually enough for a first pass. Go deeper only where the interviewer probes, such as the datastore or the ID generator, and write scaling and trade-off notes next to the boxes rather than drawing every possible component.
Sources
All pages were checked on 9 October 2026 (IST).
- Mermaid: Flowchart syntax: cylindrical shape
[( )], subroutine shape[[ ]], dotted link-.->. - mermaid.ink: the hosted render service we used for the worked example.
- RFC 9110: HTTP Semantics: 301 and 302 definitions; a 301 is heuristically cacheable, and 302 is not in the list of heuristically cacheable status codes.
- MDN: 301 Moved Permanently: permanent redirect behaviour.
- MDN: 302 Found: temporary redirect behaviour.
- The System Design Primer (GitHub): further reading: a four-step outline for approaching a system design interview question.
- The C4 model: further reading: a set of hierarchical diagrams (system context, containers, components, code).
- Our homepage (bytediagram.com): the list of eight diagram types and the AI-assisted generation description.
Redraw your practice design
Turn the sketch from your mock interview into a clean architecture diagram you can keep and revise.
Open Diagram Editor